Where we stand on tariffs?
Below is a comparative table summarizing the state of U.S. tariffs before Donald Trump’s first election in 2016, the current state as of July 2025, and an analysis of potential future trends based on available data and economic insights. The table focuses on key metrics like average tariff rates, major trading partners affected, and economic impacts. The analysis considers Trump’s tariff policies, historical trends, and economic projections, while critically examining potential outcomes.
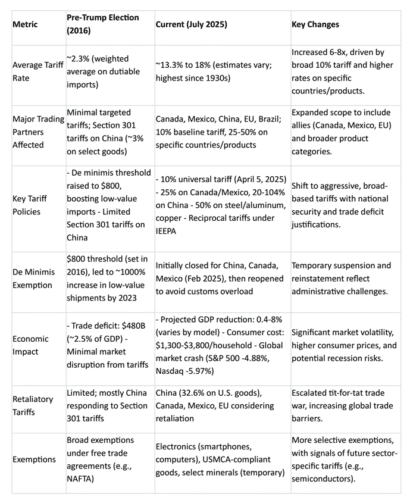
Comparative Table: U.S. Tariffs Before Trump (2016) vs. Current (July 2025)
Analysis of Tariff Trends and Future Projections
Context and Historical Comparison
- Pre-2016 Baseline: Before Trump’s first term, U.S. tariffs were low, averaging ~2.3% on dutiable imports, with minimal targeted tariffs (e.g., Section 301 on China). The trade deficit was $480 billion (2.5% of GDP), and the de minimis threshold increase to $800 in 2016 fueled a surge in low-value imports, particularly from Chinese e-commerce platforms like Shein and Temu. Global trade was relatively open, with free trade agreements like NAFTA reducing barriers.
- 2025 Landscape: Trump’s second-term tariff policies, enacted under the International Emergency Economic Powers Act (IEEPA) and Section 232/301 authorities, have dramatically raised the average tariff rate to 13.3-18%, the highest since the 1930s. Key actions include a 10% universal tariff (April 5, 2025), 25% tariffs on Canada and Mexico, up to 104-125% on China (later reduced to 51.1% after negotiations), and 50% on steel, aluminum, and copper. These tariffs aim to address trade deficits, national security, and issues like drug trafficking and migration, but have triggered market volatility (e.g., S&P 500 and Nasdaq crashes) and retaliatory tariffs from China, Canada, and others. Economic models project significant GDP losses (0.4-8%) and consumer price increases ($1,300-$3,800 per household).
Future Trends and Where Tariffs Might Land
Predicting the future of Trump’s tariff regime involves analyzing current policies, economic constraints, and political dynamics. Below are key factors and projections:
- Escalation and Negotiation Dynamics:
- Short-Term (2025-2026): Trump’s aggressive tariff stance, including 30% tariffs on the EU and 50% on Brazil (effective August 1, 2025), suggests continued escalation unless trading partners negotiate concessions. The temporary suspension of higher “reciprocal” tariffs (e.g., 125% on China reduced to 51.1% after Geneva talks) and exemptions for electronics indicate flexibility when faced with practical challenges or diplomatic progress. Expect targeted increases in sectors like semiconductors and pharmaceuticals, as investigations are underway.
-
- Long-Term (2027 and Beyond): Trump’s goal of reducing the trade deficit and re-shoring manufacturing may lead to sustained high tariffs unless offset by trade agreements (e.g., US-UK deal, potential US-India trade agreement). However, global retaliation and supply chain shifts (e.g., Chinese firms moving operations to Vietnam) could limit effectiveness, as seen in Trump’s first term.
- Economic and Political Constraints:
- Economic Impact: Models from Penn Wharton and Yale Budget Lab project GDP reductions of 0.4-8% and consumer losses of $1,700-$3,800 per household, with apparel prices rising 17%. A potential U.S. recession, combined with downgraded global growth forecasts (IMF, OECD), may pressure Trump to moderate tariffs to avoid voter backlash. The $75 billion in tariff revenue (as of June 2025) is significant but far from replacing income taxes, as some administration officials claim.
-
- Political Pushback: Bipartisan Senate opposition to Canada tariffs and resistance from Republican free-market advocates (e.g., Gary Cohn’s 2018 resignation) suggest political limits. If economic pain intensifies, Congress or public sentiment could force adjustments, especially with midterms in 2026.
- Global and Domestic Responses:
- Retaliation: China’s tariffs on U.S. goods (32.6% average) and potential EU/Brazil counter-tariffs could escalate trade wars, raising global trade barriers and costs. Currency devaluations (e.g., Mexico’s peso down 30%, Canada’s dollar down 8%) may soften the impact on foreign exporters but hurt U.S. export competitiveness.
-
- Supply Chain Shifts: Chinese firms like Temu and Shein are already adapting by expanding U.S.-based warehousing and sourcing from non-tariffed countries. This mirrors first-term trends where Chinese solar panel makers evaded tariffs via Southeast Asia. Domestic manufacturers may benefit from re-shoring (e.g., $10 billion in steel mill investments during Trump’s first term), but automation and global supply chains limit job gains.
- Likely Outcomes:
- Optimistic Scenario: Tariffs stabilize at 10-15% as trade agreements (e.g., Mar-a-Lago Accord, US-UK deal) reduce tensions and exemptions expand for critical goods (e.g., semiconductors, pharmaceuticals). The trade deficit narrows slightly, but GDP growth remains sluggish (1.4% globally in Q4 2025). Consumer prices rise moderately (2-3%), and re-shoring boosts select industries like steel and autos.
-
- Pessimistic Scenario: Tariffs rise to 20-25% with broader product coverage, triggering a full-scale trade war. Retaliation and supply chain disruptions cause a U.S. recession, with GDP losses of 5-8% and household costs exceeding $5,000 annually. Global growth stagnates, and markets remain volatile, with the S&P 500 and Nasdaq facing further declines.
-
- Middle Ground (Most Likely): Tariffs settle at 15-20% by 2027, with selective exemptions and negotiated reductions for allies like the EU and Canada. Economic growth slows (0.5-1% GDP reduction), and consumer prices rise ~3-5%. Re-shoring occurs in niche sectors, but trade deficits persist due to global supply chain adaptability and currency effects. Political and economic pressures force Trump to balance protectionism with pragmatic concessions.
Critical Perspective
Trump’s tariffs reflect a protectionist vision to boost U.S. manufacturing and address trade imbalances, but historical evidence from his first term shows limited success—trade deficits grew from $480B to $653B despite tariffs. Economists near-universally dispute claims that tariffs cost foreign countries rather than U.S. consumers, as domestic importers bear the tax burden. The reliance on national security justifications (e.g., IEEPA) risks overreach, and global retaliation could undermine U.S. export competitiveness. While tariffs may drive some re-shoring, automation and global supply chains limit job creation, and consumer price hikes disproportionately harm low-income households. The administration’s narrative of “Liberation Day” and “America First” ignores these complexities, and projections of a “new golden age” are optimistic given economic models forecasting downturns.
Recommendations for Monitoring
- Track USTR and Commerce Department Notices: Ongoing Section 232/301 investigations (e.g., semiconductors, pharmaceuticals) will shape future tariff scope.
- Monitor Retaliation: Watch for EU, China, and Brazil’s responses, as counter-tariffs could escalate costs.
- Economic Indicators: Follow GDP growth, consumer price indices, and trade deficit data from the Bureau of Economic Analysis and Treasury Department for real-time impacts.
- Political Developments: Senate votes and public sentiment will influence tariff sustainability.